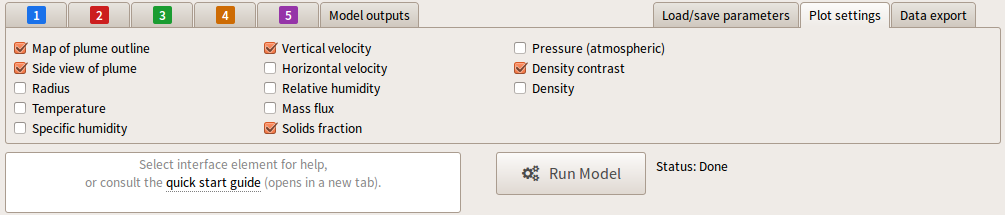
The Plot settings tab allows the selection of plots of PlumeRise solutions. Plots are requested by selecting the checkboxes. If parameter sets 2 through 5 are active, the plots show multiple solutions, colour-coded to match the colour of the parameter set, with
- blue curves displaying results using parameter set 1;
- red curves displaying results using parameter set 2;
- green curves displaying results using parameter set 3;
- orange curves displaying results using parameter set 4;
- purple curves displaying results using parameter set 5.
The table below gives details of the plots that can be selected from Plot settings with examples taken from a PlumeRise calculation in which parameter sets 1, 2 and 3 are active.
| Plot | Description | Example |
|---|---|---|
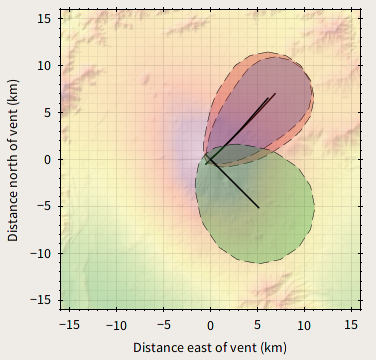
| Map of plume outline | A plan view of the plume trajectory and plume outline. If vent latitude and vent longitude are entered in the 'Parameters' tab then a digital elevation map is provided as a background to the plot. If vent latitude and vent longitude are left blank in the 'Parameters' tab then no background map is displayed on the plot. |
 |
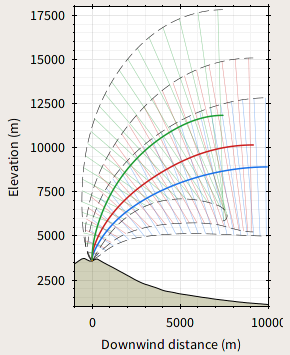
| Side view of plume | A cross section through the plume, demonstrating the growth in the plume width. The centreline trajectory is shown as a coloured solid line. Note the trajectory shown does not account for the changing direction of the plume in the horizontal plane. The plume radius (dashed lines) show the plume width, assuming a Gaussian profile for the concentration of species within the plume. Gaussian profiles are found in experiments for vertically rising plumes. For a bent-over plume, we assume a Gaussian profile describes the leading order plume profile. The plume model assumes the plume is circular in a cross section normal to the plume centreline. The normal to the centreline are shown as coloured chord lines (joining the centreline to the plume edges) and demonstrate the increasing plume width with distance along the centreline due to entrainment. Note that, on occasion, normal lines joining the centreline with the lower plume edge can intersect. If vent latitude and vent longitude are entered in the 'Parameters' tab then a topographic profile is provided on the plot. The topography is taken along the wind direction of the meteorology used in parameter set 1 only. If vent latitude and vent longitude are left blank in the 'Parameters' tab then no topographic map is displayed. |
 |
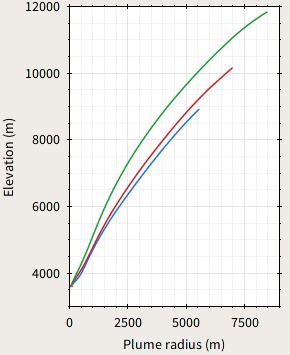
| Radius | The plume radius as a function of height. We assume a Gaussian profile for the concentration of species within the plume. Gaussian profiles are found in experiments for vertically rising plumes. For a bent-over plume, we assume a Gaussian profile describes the leading order plume profile. The radius here refers to the standard deviation of the Gaussian profile. Therefore the Gaussian radius contains approximately 68% of the mass of the plume in any cross-section (normal to the centreline). |
 |
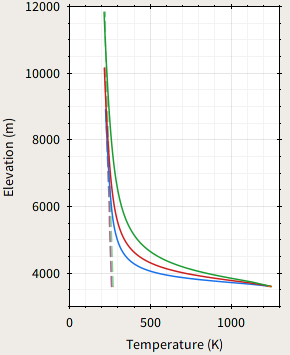
| Temperature | The bulk temperature of the plume as a function of height (coloured solid lines). The temperature here is the top-hat value (i.e. the value assuming the temperature is uniform within the plume). Coloured dashed lines show the temperature of the atmosphere. Note if several parameter sets have the same atmospheric temperature profile, the corresponding dashed lines will overlie and the dashed line may appear gray. |
 |
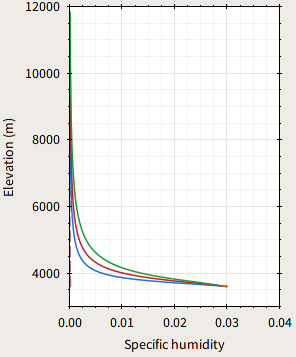
| Specific humidity | The specific humidity in the plume as a function of height (coloured solid lines). Coloured dashed lines show the specific humidity of the atmosphere. Note if several parameter sets have the same atmospheric profile, the corresponding dashed lines will overlie and the dashed line may appear gray. The specific humidity is the ratio of the mass of water vapour to the total mass of gas. |
 |
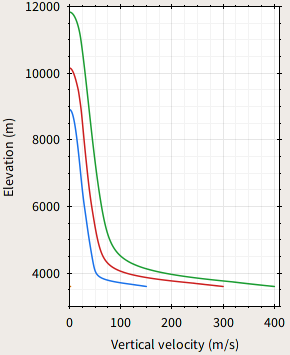
| Vertical velocity | The vertical component of the plume velocity as a function of height (coloured solid lines). The velocity shown is the top-hat velocity (i.e. assuming the velocity is uniform in a cross-section of the plume normal to the centreline). |
 |
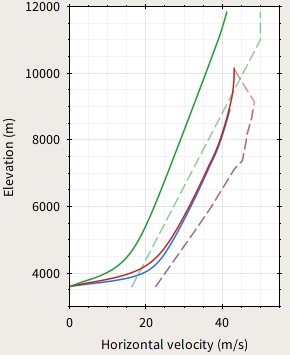
| Horizontal velocity | The horizontal component of the plume velocity as a function of height (coloured solid lines). Coloured dashed lines show the wind speed. Note if several parameter sets have the same atmospheric wind profile, the corresponding dashed lines will overlie and the dashed line may appear gray. The velocity shown is the top-hat velocity (i.e. assuming the velocity is uniform in a cross-section of the plume normal to the centreline). |
 |
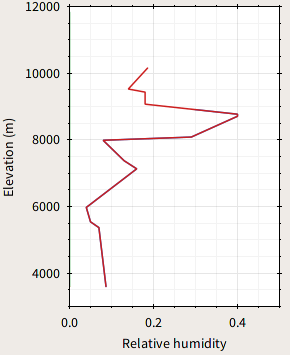
| Relative humidity | The relative humidity of the atmosphere as a function of height. Note if several parameter sets have the same relative humidity profile, the corresponding dashed lines will overlie and the dashed line may appear gray. The relative humidity is the ratio of the partial pressure of water vapour to the saturation vapour pressure. |
 |
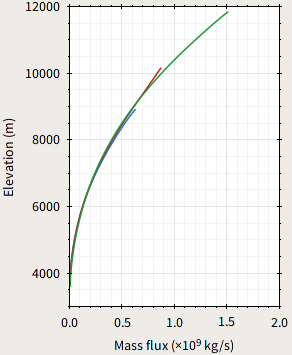
| Mass flux | The total mass flux of the plume as a function of height. The plume is composed of solid pyroclasts, magmatic gases (here assumed to be entirely water vapour), entrained dry air, entrained water vapour, and water that has condensed in the plume. Each species contributes to the total mass of the plume. The total mass flux increases with height due to the entrainment of atmospheric gases. |
 |
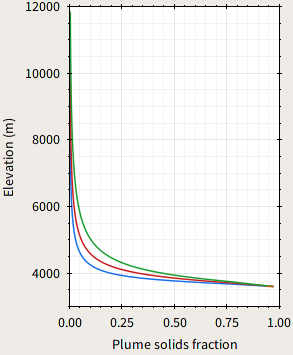
| Solids fraction | The mass fraction of solids in the plume as a function of height. The solid phase in the plume is composed of pyroclasts ejected with magmatic gases at the plume vent. Our model includes only those pyroclasts that are carried with the gases at the vent, so does not account for solid particles that are thrown from the vent and follow ballistic trajectories. We do not attempt to model the fallout of pyroclasts from the plume as (i) the solids do not play an important role except very close to the vent, where they contribute a significant fraction of the total mass and have yet to thermally equilibrate with the plume gases, and (ii) it is currently not known how to parameterize fallout and re-entrainment of solid particles when the plume rises in a wind-field. The rapid decrease in the solid mass fraction is therefore due to the entrainment of atmospheric air. |
 |
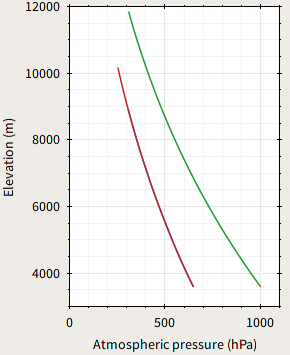
| Pressure (atmospheric) | The pressure of the atmosphere as a function of height. The model assumes the pressure in the plume instantaneously equilibrates with the the atmospheric pressure. Therefore, high Mach number conditions at the vent cannot be modelled. Note if several parameter sets have the same atmospheric pressure profile, the corresponding lines will overlie and the line may appear gray. |
 |
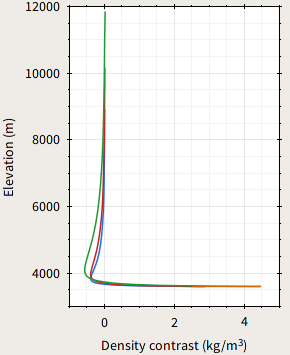
| Density contrast | The difference between the plume density and the atmospheric density as a function of height, (ρplume - ρatmosphere). The magnitude of the buoyancy force is proportional to ρatmosphere - ρplume. Therefore, a positive density contrast corresponds to deceleration of the vertical component of the plume motion, whereas a negative density contrast corresponds to acceleration of the vertical motion. For solids-rich plumes at the vent, the erupted material is often more dense than the atmosphere and the material initially rises as a momentum jet. The entrainment, heating and expansion of atmospheric gases may lead to the density contrast becoming negative and a buoyant plume. However, if there is insufficient entrainment or heating of the air, the erupted material may not become buoyant. |
 |
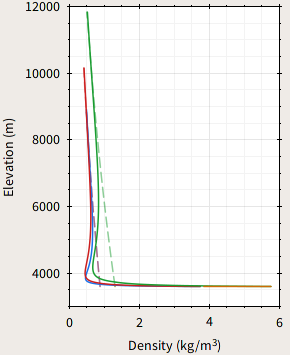
| Density | The bulk density of the plume as a function of height (coloured solid lines). The bulk density is determined from the contributions of the solid phase, the gaseous phases (dry air and water vapour) and the condensed phase (liquid water, if present). Dashed lines show the density of the atmosphere. Note if several parameter sets have the same atmospheric density profile, the corresponding dashed lines will overlie and the dashed line may appear gray. |
 |